Project: Modeling Evolution

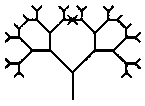
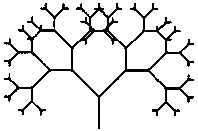
This program will display a basic "biomorph"
like the one shown to the right. The actual drawing is described by 9 genes,
described below. Along with this initial drawing are the 18 mutation
drawings (the "mutation array") obtained by either an "upward" mutation (adding
one to a gene's value) or a "downward" mutation (subtracting one to a gene's
value). Each biomorph in the mutation array is only a single-step mutation
from the original; i.e. only one gene is changed by a value of one from
the original drawing for the additional drawing. Two sample drawings
are shown below by adding or subtracting one from gene 9.

|
| 
|
| Gene 9 Downward
|
| Gene 9 Upward
|
This program uses the winbgim library and the user
can use the mouse to select which of the drawings to continue mutating.
The program will take the drawing the user selected and redraw another screen with
the selected drawing and a new mutation array. This is not a true path of evolution
because it is being guided by what aesthetically pleases the user. It is called
cumulative selection because some desired output is trying to be created.
If you decide to change the source code, don't assume that
your pictures need to look like the examples here. The genes outlined below are only
a suggestion. Be creative; make up whatever relations between the genes you desire.
The program will surely astound you with the results. Feel free to add more genes to
give more control to the program.
- Gene 1: Number of units that the lines will move in the horizontal direction
- Gene 2: Relationship between genes 1 and 5 (i.e. how much gene 5 influences
the amount of units the lines move in the horizontal direction)
- Gene 3: Length of the next iterative line in terms of the previous one
- Gene 4: A gene limiting the height of the biomorph as the branching level deepens
(i.e. how much genes 5 and 9 influence the movement in the positive y direction)
- Gene 5: Number of units that the lines will move in the positive vertical direction
for lines branching above the horizontal axis
- Gene 6: Number of units that the lines will move in the negative vertical direction
for lines branching below the horizontal axis
- Gene 7: Relationship between genes 1 and 6 (i.e. how much gene 6 influences
the movement in the horizontal direction)
- Gene 8: Relationship between genes 3 and 6 (i.e. how much gene 3 influences
the movement in the negative y direction)
- Gene 9: Level of branching. That is, it controls how many times
the program iterates the effects of the genes. This controls how large the
tree gets by allowing more or less sub-branches on each branch. See the
images above.
The program performs two other actions.
- A gene viewer allows the user to input values for each of the 9 genes and
view what the biomorph looks like.
- If the user right-clicks on either the original biomorph or one in the mutation array,
the program will show a full screen enlargement of that picture. All the gene values
(the "chromosome") associated with that picture are be displayed so that the user
can view the biomorph again any time using the gene viewer. The user is then able to
click the left mouse button to get back to the mutation array and continue evolving.
NOTES:
The gene values do not depend on each other; they are independently
assigned. They do, however, collectively define how the biomorph will look. That is, Gene
1 should NOT be defined in terms of other genes. The interaction between the genes takes
place when calculating how the structure will look.
This project was inspired by the book The Blind Watchmaker by Richard Dawkins.
The project was proposed by Grant Macklem.


